Ichimoku Cloud Breakout Only LongThis is a very simple trading strategy based exclusively on the Ichimoku Cloud. There are no additional indicators or complex rules involved. The key condition is that we only open long positions when the price is clearly above the cloud — indicating a bullish trend.
For optimal results, the recommended timeframes are 1D (daily) or 1W (weekly) charts. These higher timeframes help filter out market noise and provide more reliable trend signals.
We do not short the market under any circumstances. The focus is purely on riding upward momentum when the price breaks out or stays above the cloud.
This strategy works best when applied to growth stocks with strong upward trends and good fundamentals — such as Google (GOOGL), Tesla (TSLA), Apple (AAPL), or NVIDIA (NVDA).
"Ichimoku Cloud " için komut dosyalarını ara

CM Enhanced Ichimoku Cloud V5Ichimoku Cloud Indicator With Cloud Shading Based On Trend!!!
I’m releasing this Indicator b/c of the New Feature that Allows Coding The Fill of The Cloud To Change Colors Based On Trend. However, I will be releasing a Much More Advanced Version Soon!!!
Current Features - Via Inputs Tab:
- Ability to Turn On/Off Every Plot Individually Via Check Box
- Ability To Turn On/Off Tenkan and Kinjun Crosses (Arrows)
***Features Coming Soon - All Will Have Capability to Turn On/Off:
- Bar Color Change when Entering The Cloud
- Filtered Tenkan and Kinjun Crosses To Plot Only With Trend, only Counter Trend, Or All Crosses
- Plot Arrows When Price Exits The Cloud.
- Plot Arrows When Lagging Line Crosses The Cloud Confirmed, or Not Confirmed by Price.
- Plus More!!!
- Basically Ability To Set Alerts Based On Any Condition!!!
WHAT ARE YOUR REQUESTS FOR FEATURES??? Comment Below.

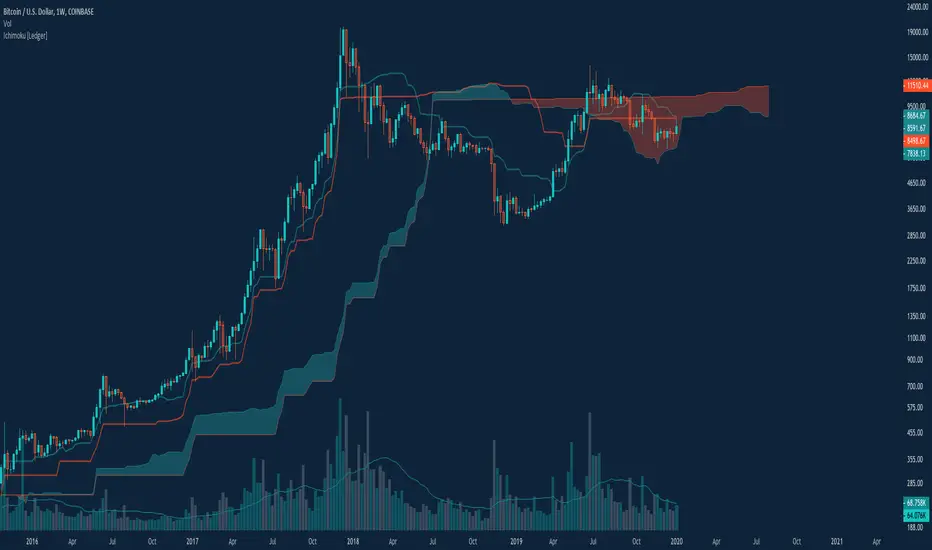
Ichimoku Cloud with Presets [Ledger]This is not too innovative, but I look at cloud setups with single and doubled settings, using both the traditional inputs for legacy markets, and "24/7" formatted inputs initially established by my friend CarpeNoctom and popularized for crypto markets. This makes those inputs a toggle that's easy to adjust. That's about it. Otherwise, it's the classic Ichimoku cloud. This is a fork of 's iteration, with my own flare and some minor adjustments. I have some ideas I would eventually like to include with this, but I've been using it this way for a long time and figure I should publish it.
Ichimoku Cloud and ADX with Trailing Stop Loss (by Coinrule)The Ichimoku Cloud is a collection of technical indicators that show support and resistance levels, as well as momentum and trend direction. It does this by taking multiple averages and plotting them on a chart. It also uses these figures to compute a “cloud” that attempts to forecast where the price may find support or resistance in the future.
The Ichimoku Cloud was developed by Goichi Hosoda, a Japanese journalist, and published in the late 1960s. It provides more data points than the standard candlestick chart. While it seems complicated at first glance, those familiar with how to read the charts often find it easy to understand with well-defined trading signals.
The Ichimoku Cloud is composed of five lines or calculations, two of which comprise a cloud where the difference between the two lines is shaded in.
The lines include a nine-period average, a 26-period average, an average of those two averages, a 52-period average, and a lagging closing price line.
The cloud is a key part of the indicator. When the price is below the cloud, the trend is down. When the price is above the cloud, the trend is up.
The above trend signals are strengthened if the cloud is moving in the same direction as the price. For example, during an uptrend, the top of the cloud is moving up, or during a downtrend, the bottom of the cloud is moving down.
DMI is simple to interpret. When +DI > - DI, it means the price is trending up. On the other hand, when -DI > +DI, the trend is weak or moving on the downside. The ADX does not give an indication of the direction but about the strength of the trend.
Typically values of ADX above 25 mean that the trend is steeply moving up or down, based on the -DI and +DI positioning. This script aims to capture swings in the DMI, and thus, in the trend of the asset, using a contrarian approach.
Trading on high values of ADX, the strategy tries to spot extremely oversold and overbought conditions. Values of ADX above 45 may suggest that the trend has overextended and is maybe about to reverse.
This strategy combines the Ichimoku Cloud with the ADX indicator to better enter trades.
Long orders are placed when these basic signals are triggered.
Long Position:
Tenkan-Sen is above the Kijun-Sen
Chikou-Span is above the close of 26 bars ago
Close is above the Kumo Cloud
MACD line crosses over the signal line
-DI is greater than +DI
ADX is greater than 45
Close Position:
3% increase trailing
3% decrease trailing
The script is backtested from December 2022 and provides good returns.
A trading fee of 0.1% is also taken into account and is aligned to the base fee applied on Binance.

Ichimoku Cloud with MACD and Trailing Stop Loss (by Coinrule)The Ichimoku Cloud is a collection of technical indicators that show support and resistance levels, as well as momentum and trend direction. It does this by taking multiple averages and plotting them on a chart. It also uses these figures to compute a “cloud” that attempts to forecast where the price may find support or resistance in the future.
The Ichimoku Cloud was developed by Goichi Hosoda, a Japanese journalist, and published in the late 1960s. It provides more data points than the standard candlestick chart. While it seems complicated at first glance, those familiar with how to read the charts often find it easy to understand with well-defined trading signals.
The Ichimoku Cloud is composed of five lines or calculations, two of which comprise a cloud where the difference between the two lines is shaded in.
The lines include a nine-period average, a 26-period average, an average of those two averages, a 52-period average, and a lagging closing price line.
The cloud is a key part of the indicator. When the price is below the cloud, the trend is down. When the price is above the cloud, the trend is up.
The above trend signals are strengthened if the cloud is moving in the same direction as the price. For example, during an uptrend, the top of the cloud is moving up, or during a downtrend, the bottom of the cloud is moving down.
The MACD is a trend following momentum indicator and provides identification of short-term trend direction. In this variation it utilises the 12-period as the fast and 26-period as the slow length EMAs, with signal smoothing set at 9.
This strategy combines the Ichimoku Cloud with the MACD indicator to better enter trades.
Long/Exit orders are placed when three basic signals are triggered.
Long Position:
Tenkan-Sen is above the Kijun-Sen
Chikou-Span is above the close of 26 bars ago
Close is above the Kumo Cloud
MACD line crosses over the signal line
Exit Position:
Price increases 3% trailing
Price decreases 3% trailing
The script is backtested from 1 June 2022 and provides good returns.
The strategy assumes each order is using 30% of the available coins to make the results more realistic and to simulate you only ran this strategy on 30% of your holdings. A trading fee of 0.1% is also taken into account and is aligned to the base fee applied on Binance.

Ichimoku Cloud and ADX with Trailing Stop Loss (by Coinrule)The Ichimoku Cloud is a collection of technical indicators that show support and resistance levels, as well as momentum and trend direction. It does this by taking multiple averages and plotting them on a chart. It also uses these figures to compute a “cloud” that attempts to forecast where the price may find support or resistance in the future.
The Ichimoku Cloud was developed by Goichi Hosoda, a Japanese journalist, and published in the late 1960s. It provides more data points than the standard candlestick chart. While it seems complicated at first glance, those familiar with how to read the charts often find it easy to understand with well-defined trading signals.
The Ichimoku Cloud is composed of five lines or calculations, two of which comprise a cloud where the difference between the two lines is shaded in.
The lines include a nine-period average, a 26-period average, an average of those two averages, a 52-period average, and a lagging closing price line.
The cloud is a key part of the indicator. When the price is below the cloud, the trend is down. When the price is above the cloud, the trend is up.
The above trend signals are strengthened if the cloud is moving in the same direction as the price. For example, during an uptrend, the top of the cloud is moving up, or during a downtrend, the bottom of the cloud is moving down.
DMI is simple to interpret. When +DI > - DI, it means the price is trending up. On the other hand, when -DI > +DI , the trend is weak or moving on the downside. The ADX does not give an indication about the direction but about the strength of the trend.
Typically values of ADX above 25 mean that the trend is steeply moving up or down, based on the -DI and +D positioning. This script aims to capture swings in the DMI, and thus, in the trend of the asset, using a contrarian approach.
Trading on high values of ADX, the strategy tries to spot extremely oversold and overbought conditions. Values of ADX above 45 may suggest that the trend has overextended and is may be about to reverse.
This strategy combines the Ichimoku Cloud with the ADX indicator to better enter trades.
Long orders are placed when these basic signals are triggered.
Long Position:
Tenkan-Sen is above the Kijun-Sen
Chikou-Span is above the close of 26 bars ago
Close is above the Kumo Cloud
MACD line crosses over the signal line
-DI is greater than +DI
ADX is greater than 45
Close Position:
3% increase trailing
3% decrease trailing
The script is backtested from 1 January 2018 and provides good returns.
The strategy assumes each order is using 30% of the available coins to make the results more realistic and to simulate you only ran this strategy on 30% of your holdings. A trading fee of 0.1% is also taken into account and is aligned to the base fee applied on Binance.
This script also works well on MATIC (1d timeframe), ETH (1d timeframe), and SOL (1d timeframe).

Ichimoku Cloud and Bollinger Bands (by Coinrule)The Ichimoku Cloud is a collection of technical indicators that show support and resistance levels, as well as momentum and trend direction. It does this by taking multiple averages and plotting them on a chart. It also uses these figures to compute a “cloud” that attempts to forecast where the price may find support or resistance in the future.
The Ichimoku Cloud was developed by Goichi Hosoda, a Japanese journalist, and published in the late 1960s. It provides more data points than the standard candlestick chart. While it seems complicated at first glance, those familiar with how to read the charts often find it easy to understand with well-defined trading signals.
The Ichimoku Cloud is composed of five lines or calculations, two of which comprise a cloud where the difference between the two lines is shaded in.
The lines include a nine-period average, a 26-period average, an average of those two averages, a 52-period average, and a lagging closing price line.
The cloud is a key part of the indicator. When the price is below the cloud, the trend is down. When the price is above the cloud, the trend is up.
The above trend signals are strengthened if the cloud is moving in the same direction as the price. For example, during an uptrend, the top of the cloud is moving up, or during a downtrend, the bottom of the cloud is moving down.
The Bollinger Bands are among the most famous and widely used indicators. A Bollinger Band is a technical analysis tool defined by a set of trendlines plotted two standard deviations (positively and negatively) away from a simple moving average ( SMA ) of a security's price, but which can be adjusted to user preferences. They can suggest when an asset is oversold or overbought in the short term, thus providing the best time for buying and selling it.
This strategy combines the Ichimoku Cloud with Bollinger Bands to better enter trades.
Long orders are placed when these basic signals are triggered.
Long Position:
Tenkan-Sen is above the Kijun-Sen
Chikou-Span is above the close of 26 bars ago
Close is above the Kumo Cloud
The closing price is greater than the upper standard deviation of the Bollinger Bands
Short Position:
Tenkan-Sen is below the Kijun-Sen
Chikou-Span is below the close of 26 bars ago
Close is below the Kumo Cloud
The upper standard deviation of the Bollinger Band is greater than the closing price
The script is backtested from 1 January 2022 and provides good returns.
The strategy assumes each order is using 30% of the available coins to make the results more realistic and to simulate you only ran this strategy on 30% of your holdings. A trading fee of 0.1% is also taken into account and is aligned to the base fee applied on Binance.
This script also works well on BTC 30m/1h, ETH 2h, MATIC 2h/30m, AVAX 1h/2h, SOL 45m timeframes

Ichimoku Cloud with ADX (By Coinrule)The Ichimoku Cloud is a collection of technical indicators that show support and resistance levels, as well as momentum and trend direction. It does this by taking multiple averages and plotting them on a chart. It also uses these figures to compute a “cloud” that attempts to forecast where the price may find support or resistance in the future.
The Ichimoku Cloud was developed by Goichi Hosoda, a Japanese journalist, and published in the late 1960s. It provides more data points than the standard candlestick chart. While it seems complicated at first glance, those familiar with how to read the charts often find it easy to understand with well-defined trading signals.
The Ichimoku Cloud is composed of five lines or calculations, two of which comprise a cloud where the difference between the two lines is shaded in.
The lines include a nine-period average, a 26-period average, an average of those two averages, a 52-period average, and a lagging closing price line.
The cloud is a key part of the indicator. When the price is below the cloud, the trend is down. When the price is above the cloud, the trend is up.
The above trend signals are strengthened if the cloud is moving in the same direction as the price. For example, during an uptrend, the top of the cloud is moving up, or during a downtrend, the bottom of the cloud is moving down.
DMI is simple to interpret. When +DI > - DI, it means the price is trending up. On the other hand, when -DI > +DI , the trend is weak or moving on the downside. The ADX does not give an indication about the direction but about the strength of the trend.
Typically values of ADX above 25 mean that the trend is steeply moving up or down, based on the -DI and +D positioning. This script aims to capture swings in the DMI, and thus, in the trend of the asset, using a contrarian approach.
Trading on high values of ADX , the strategy tries to spot extremely oversold and overbought conditions. Values of ADX above 45 may suggest that the trend has overextended and is may be about to reverse.
This strategy combines the Ichimoku Cloud with the ADX indicator to better enter trades.
Long/Short orders are placed when these basic signals are triggered.
Long Position:
Tenkan-Sen is above the Kijun-Sen
Chikou-Span is above the close of 26 bars ago
Close is above the Kumo Cloud
MACD line crosses over the signal line
-DI is greater than +DI
ADX is greater than 45
Short Position:
Tenkan-Sen is below the Kijun-Sen
Chikou-Span is below the close of 26 bars ago
Close is below the Kumo Cloud
MACD line crosses under the signal line
+DI is greater than -DI
ADX is less than 45
The script is backtested from 1 January 2022 and provides good returns.
The strategy assumes each order is using 30% of the available coins to make the results more realistic and to simulate you only ran this strategy on 30% of your holdings. A trading fee of 0.1% is also taken into account and is aligned to the base fee applied on Binance.
This script also works well on MATIC (15m timeframe), ETH (5m timeframe), and SOL (15m timeframe).

Ichimoku Cloud with MACD (By Coinrule)The Ichimoku Cloud is a collection of technical indicators that show support and resistance levels, as well as momentum and trend direction. It does this by taking multiple averages and plotting them on a chart. It also uses these figures to compute a “cloud” that attempts to forecast where the price may find support or resistance in the future.
The Ichimoku Cloud was developed by Goichi Hosoda, a Japanese journalist, and published in the late 1960s. It provides more data points than the standard candlestick chart. While it seems complicated at first glance, those familiar with how to read the charts often find it easy to understand with well-defined trading signals.
The Ichimoku Cloud is composed of five lines or calculations, two of which comprise a cloud where the difference between the two lines is shaded in.
The lines include a nine-period average, a 26-period average, an average of those two averages, a 52-period average, and a lagging closing price line.
The cloud is a key part of the indicator. When the price is below the cloud, the trend is down. When the price is above the cloud, the trend is up.
The above trend signals are strengthened if the cloud is moving in the same direction as the price. For example, during an uptrend, the top of the cloud is moving up, or during a downtrend, the bottom of the cloud is moving down.
The MACD is a trend following momentum indicator and provides identification of short-term trend direction. In this variation it utilises the 12-period as the fast and 26-period as the slow length EMAs, with signal smoothing set at 9.
This strategy combines the Ichimoku Cloud with the MACD indicator to better enter trades.
Long/Short orders are placed when three basic signals are triggered.
Long Position:
Tenkan-Sen is above the Kijun-Sen
Chikou-Span is above the close of 26 bars ago
Close is above the Kumo Cloud
MACD line crosses over the signal line
Short Position:
Tenkan-Sen is below the Kijun-Sen
Chikou-Span is below the close of 26 bars ago
Close is below the Kumo Cloud
MACD line crosses under the signal line
The script is backtested from 1 June 2022 and provides good returns.
The strategy assumes each order is using 30% of the available coins to make the results more realistic and to simulate you only ran this strategy on 30% of your holdings. A trading fee of 0.1% is also taken into account and is aligned to the base fee applied on Binance.
This script also works well on MATIC (1h timeframe), AVA (45m timeframe), and BTC (30m timeframe).

Ichimoku Cloud with RSI (By Coinrule)The Ichimoku Cloud is a collection of technical indicators that show support and resistance levels, as well as momentum and trend direction. It does this by taking multiple averages and plotting them on a chart. It also uses these figures to compute a “cloud” that attempts to forecast where the price may find support or resistance in the future.
The Ichimoku Cloud was developed by Goichi Hosoda, a Japanese journalist, and published in the late 1960s. It provides more data points than the standard candlestick chart. While it seems complicated at first glance, those familiar with how to read the charts often find it easy to understand with well-defined trading signals.
The Ichimoku Cloud is composed of five lines or calculations, two of which comprise a cloud where the difference between the two lines is shaded in.
The lines include a nine-period average, a 26-period average, an average of those two averages, a 52-period average, and a lagging closing price line.
The cloud is a key part of the indicator. When the price is below the cloud, the trend is down. When the price is above the cloud, the trend is up.
The above trend signals are strengthened if the cloud is moving in the same direction as the price. For example, during an uptrend, the top of the cloud is moving up, or during a downtrend, the bottom of the cloud is moving down.
This strategy combines the Ichimoku Cloud with the RSI indicator to better enter trades.
Long/Short orders are placed when three basic signals are triggered.
Long Position:
Tenkan-Sen is above the Kijun-Sen
Chikou-Span is above the close of 26 bars ago
Close is above the Kumo Cloud
RSI is greater less than 50
Short Position:
Tenkan-Sen is below the Kijun-Sen
Chikou-Span is below the close of 26 bars ago
Close is below the Kumo Cloud
RSI is greater than 50
The script is backtested from 1 June 2022 and provides good returns.
The strategy assumes each order is using 30% of the available coins to make the results more realistic and to simulate you only ran this strategy on 30% of your holdings. A trading fee of 0.1% is also taken into account and is aligned to the base fee applied on Binance.
This script also works well on SOL (45m timeframe), BNB (1h timeframe), and ETH (1h timeframe).

Ichimoku Cloud w/ HelpersIchimoku Cloud w/ Helpers is your standard Ichimoku Cloud indicator with two additions.
Checkout TradingView's write up on the Ichimoku Cloud here .
The two additions added to this indicator are described below:
1 — A box is drawn centered on the current bar and stretching a length equal to the 'Senkou Span B Period'.
• The box encompasses the highest high and lowest low in that period.
2 — Two new lines are added.
• Green Line : Projection from the Lagging Line (Chikou Span) to the Span A line, indicating historical price action relative to future projected support/resistance.
• Red Line : Projection from the Kijun-sen (Base Line) to the Span B line, indicating medium-term trend direction relative to future projected support/resistance.
Use cases :
• The Box is simply a visual cue to draw your eye towards the area that the Ichimoku Cloud is currently attempting to analyze: Past, Present and Future.
• The green and red lines add a way to interpret the sentiment:
• Diverging Lines with Green Above Red --> Interpret as Bullish Sentiment
• Converging Lines with Green Crossing Above Red --> Interpret as Bullish reversal or strengthening
• Converging Lines with Green Crossing Below Red --> Interpret as Bearish reversal or weakening.
• Diverging Lines with Red Above Green --> Interpret as Bearish Sentiment
• Converging Lines with Red Crossing Below Green --> Interpret as Bullish reversal or weakening bearish trend.
Current limitations :
• Under settings -> Styles, the plotted lines don't allow the colors to be changed. A bug I'm trying to figure out.
Bugs?
Kindly report any issues you run into and I'll try to fix them promptly.
Thank you!

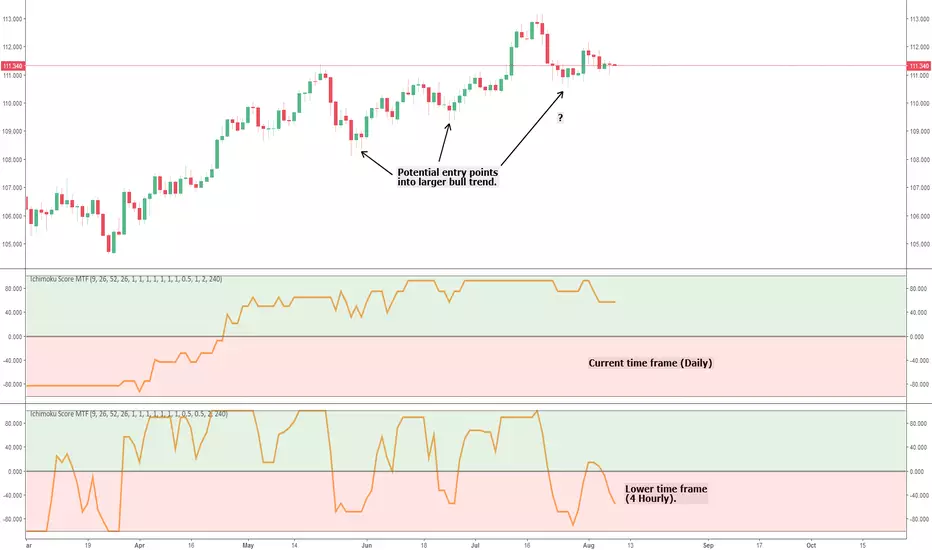
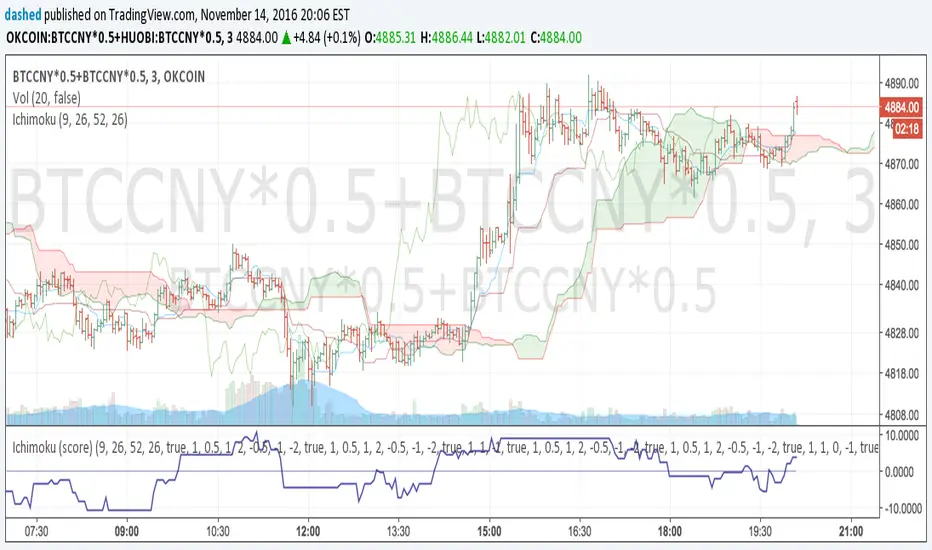
Ichimoku Cloud Score MTFThis is a simple multi time frame (MTF) conversion of the Ichimoku Cloud Score indicator.
All credit goes to the following users for the initial implementations:
- User @dashed :
- User @sjb933 :
This script calculates the Cloud Score based on the sjb933 version; all I've done is convert the script to Pinescript version 3 (to ensure the security function works as intended) and add MTF capability.
I'm a big fan of MTF analysis when using indicators (particularly oscillators). Using a higher time frame runs into the issue of the indicator repainting until the relevant higher time frame candle closes (this is inevitable and logical - so don't comment saying it repaints!). However, for lagging indicators such as this one, adding a lower time frame provides potential entry and exit signals into the larger trend, and also provides early warning of large trend shifts before the current time frame will. This can give you more control over your trades, and in my experience helps lagging indicators such as Ichimoku stay relevant in high volatility markets that are vastly different from when the indicators were conceived.
Any queries please let me know.
Cheers,
RJR
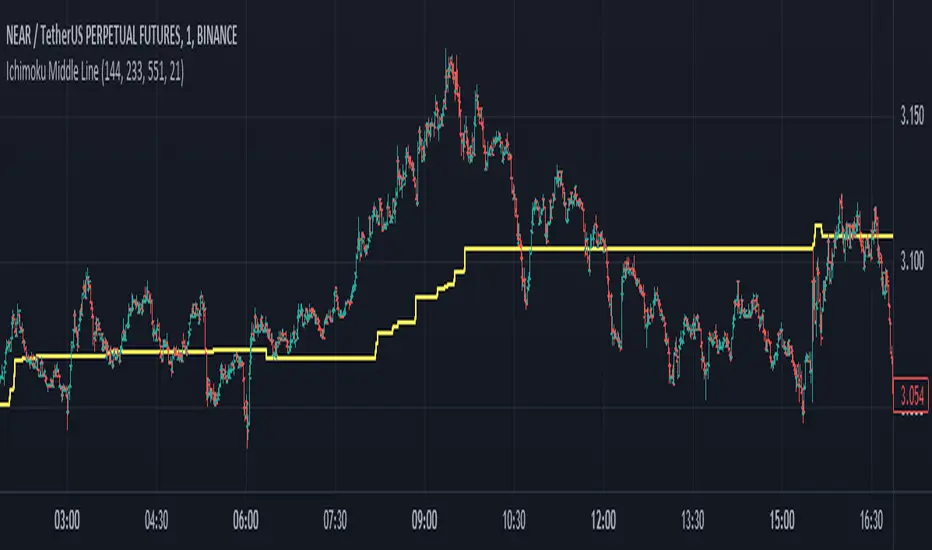
Ichimoku Cloud Middle LineMiddle Line Ichimoku cloud for my friend and me
The Ichimoku Cloud is a collection of technical indicators that show support and resistance levels, as well as momentum and trend direction. It does this by taking multiple averages and plotting them on a chart. It also uses these figures to compute a “cloud” that attempts to forecast where the price may find support or resistance in the future.
The Ichimoku Cloud was developed by Goichi Hosoda, a Japanese journalist, and published in the late 1960s.
1
It provides more data points than the standard candlestick chart. While it seems complicated at first glance, those familiar with how to read the charts often find it easy to understand with well-defined trading signals.
Ichimoku Cloud Signal Score v2.0.0Associate various ichimoku signals with a score. For example, bullish signal => positive score, and bearish signal => negative score. If the total score is above 0, it may indicate a bullish trend. Otherwise, if it is below 0, it may indicate a bearish trend.
Signals from: ichimokutrader.com/signals.html
- Tenkan Sen (turning line) / Kijun Sen Cross (standard line)
- Kijun Sen Cross (price and standard line)
- Kumo breakout
- Senkou Span Cross
- Chikou Span Cross (lag line)
- Lag line relative to cloud (misc. metric)
- Price relative to cloud (misc. metric)
The bearish/bullish scores of all the ichimoku signals + misc. metrics are totalled up and plotted.
-----
Updated script from
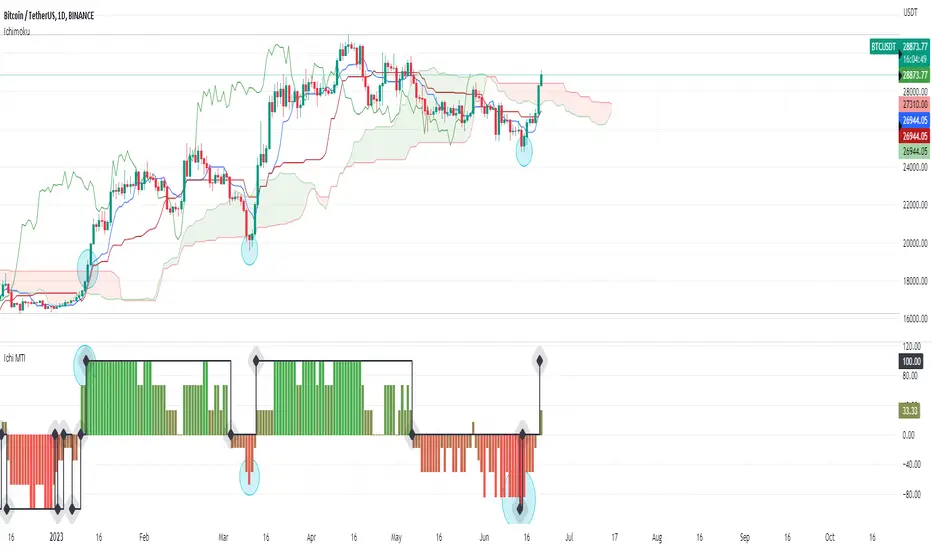
Ichimoku Cloud Momentum & Trend Indicator «NoaTrader»If you like Ichimoku cloud and use it in your analysis, or you are new to it and sometimes gets tricky to figure out all the details, this indicator tries to simplify that and visualize the change of trend and momentum relative to the past based on ichimoku.
The RED/GREEN columns are showing momentum strength while the black diamond line suggests the trend change. The conditions are simple enough to check them out on the script.
As you can see highlighted cyan circles on the chart as major important signals on the chart of Bitcoin daily timeframe.
This script tries to be complementary to the ichimoku cloud itself and cannot replace the levels represented by the cloud on chart.
Ichimoku Cloud Score v1.0This script calculates a simple Ichimoku Score based on the signals documented here , with a few additions. Each of the score components can be individually weighted via the script inputs . The output is a plot of the normalized Ichimoku score, in the range of -100 to 100.
This script has been heavily modified from 'Ichimoku Cloud Signal Score v2.0.0 '. Credit to user 'dashed' for the initial implementation.
This has been modified with several refinements:
Clean/Organized Code
Simplified Inputs
Improved Style
Scores normalized to a range (-100, 100)
Bugfixes and Improvements
Script Inputs: i.imgur.com

Ichimoku Cloud Auto TF🧠 Timeframe Breakdown for Ichimoku Cloud Auto TF
Each timeframe in this indicator is carefully calibrated to reflect meaningful Ichimoku behavior relative to its scale. Here's how each one is structured and what it's best used for:
⏱️ 1 Minute (1m)
Tenkan / Kijun / Span B: 5 / 15 / 45
Use: Scalping fast price action.
Logic: Quick reaction to short-term momentum. Best for highly active traders or bots.
⏱️ 2 Minutes (2m)
Tenkan / Kijun / Span B: 6 / 18 / 54
Use: Slightly smoother than 1m, still ideal for scalping with a little more stability.
⏱️ 5 Minutes (5m)
Tenkan / Kijun / Span B: 8 / 24 / 72
Use: Intraday setups, quick trend capture.
Logic: Balanced between reactivity and noise reduction.
⏱️ 15 Minutes (15m)
Tenkan / Kijun / Span B: 9 / 27 / 81
Use: Short-term swing and intraday entries with higher reliability.
⏱️ 30 Minutes (30m)
Tenkan / Kijun / Span B: 10 / 30 / 90
Use: Intra-swing entries or confirmation of 5m/15m signals.
🕐 1 Hour (1H)
Tenkan / Kijun / Span B: 12 / 36 / 108
Use: Ideal for swing trading setups.
Logic: Anchored to Daily reference (1H × 24 ≈ 1D).
🕐 2 Hours (2H)
Tenkan / Kijun / Span B: 14 / 42 / 126
Use: High-precision swing setups with better context.
🕒 3 Hours (3H)
Tenkan / Kijun / Span B: 15 / 45 / 135
Use: Great compromise between short and mid-term vision.
🕓 4 Hours (4H)
Tenkan / Kijun / Span B: 18 / 52 / 156
Use: Position traders & intraday swing confirmation.
Logic: Designed to echo the structure of 1D Ichimoku but on smaller scale.
📅 1 Day (1D)
Tenkan / Kijun / Span B: 9 / 26 / 52
Use: Classic Ichimoku settings.
Logic: Standard used globally for technical analysis. Suitable for swing and position trading.
📆 1 Week (1W)
Tenkan / Kijun / Span B: 12 / 24 / 120
Use: Long-term position trading & institutional swing confirmation.
Logic: Expanded ratios for broader perspective and noise filtering.
🗓️ 1 Month (1M)
Tenkan / Kijun / Span B: 6 / 12 / 24
Use: Macro-level trend visualization and investment planning.
Logic: Condensed but stable structure to handle longer data cycles.
📌 Summary
This indicator adapts Ichimoku settings dynamically to your chart's timeframe, maintaining logical ratios between Tenkan, Kijun, and Span B. This ensures each timeframe remains responsive yet meaningful for its respective market context.
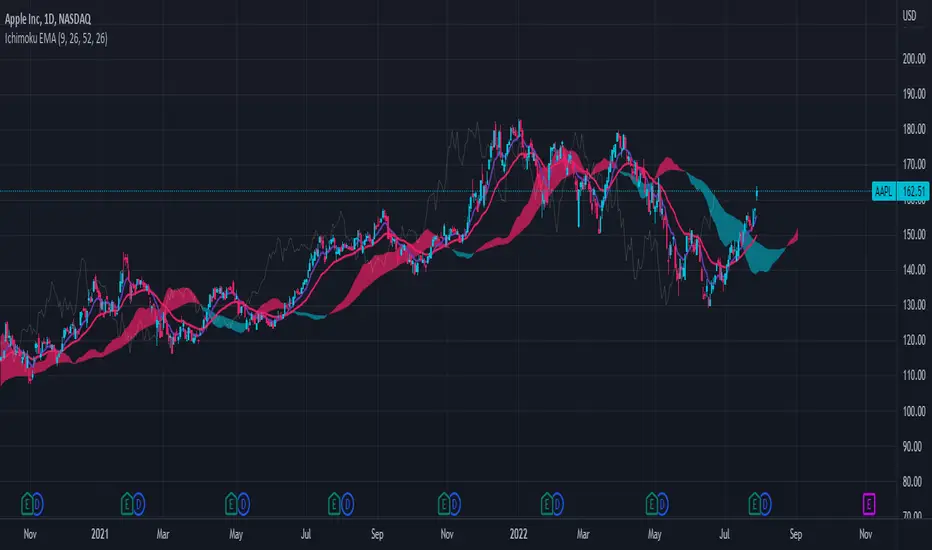
Ichimoku Cloud with EMAThis is a standard Ichimoku Cloud indicator that uses the exponential moving average (EMA) instead of the Tenkan and Kijun Sen.
It provides similar signals as the original but just looks nicer in my opinion.
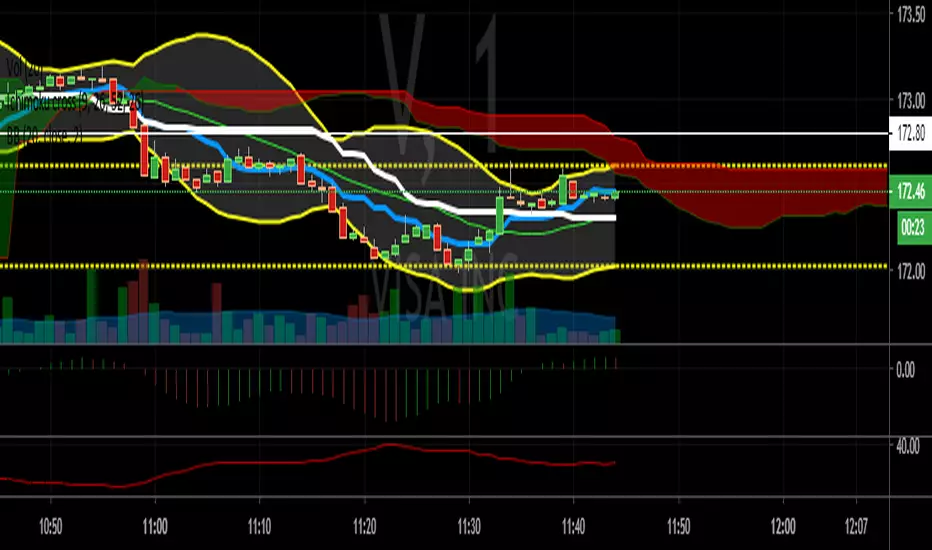
Ichimoku Cloud Smooth OscillatorThe Ichimoku Cloud is a powerful indicator to track trends. By smoothing it and placing it in a separate chart, the signals can be easily identified without cluttering the display. The bold line is the signal: green indicates a buy signal while red indicates a sell signal. Gray represents a possible change in direction and the lack of a trend. The thinner line is the width of the cloud which can be used to further determine the direction.

Ichimoku Cloud Strategy Long Only [Bitduke]Slightly modificated and optimized for Pine Script 4.0, Ichimoku Cloud Strategy which, suddenly, good suitable for the several crypto assets.
Details:
Enter position when conversion line crosses base line up, and close it when the opposite happens.
Additional condition for open / close the trade is lagging span, it should be higher than cloud to open position and below - to close it.
Backtesting:
Backtested on SOLUSDT ( FTX, Binance )
+150% for 2021 year, 8% dd
+191% for all time, 32% dd
Disadvantages:
- Small number of trades
- Need to vary parameters for different coins (not very robust)
Should be tested carefully for other coins / stock market. Different parameters could be needed or even algo modifications.
Strategy doesn't repaint.

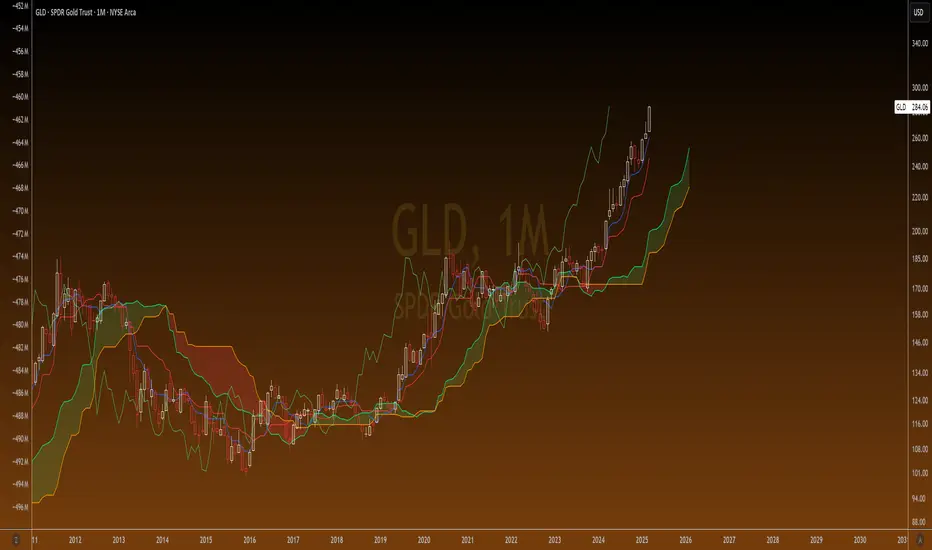
Ichimoku Cloud "Pivot"The purpose of the base and conversion lines is to give an indication of the current trend but the numerous crossings and false signals make it noisy and unreliable. This new indicator dubbed the the Ichimoku Cloud Pivot is based on an average of the IC leading spans without the time offset which are further filtered through a Donchian Channel. The result is the purple line which has fewer crossings and reliably serves as a resistance/support as shown in the diagram. It can be used in instances where the cloud fails to give a clear signal of the current trend. The brown line is the standard conversion line and is shown for reference.
MTF Ichimoku CloudIchimoku Cloud , Multiple Time Frames, based on the script : MTF Selection Framework functions (PineCoders)
Possible display:
- four differents Ichimoku
- Tenkan, Kijun, Chikou and Kumo (monochrome or not)
- labels : offset from line, color if you change style and with/without abbreviation
Time Frames :
- 1m
- 3m
- 5m
- 15m
- 30m
- 45m
- 1h
- 2h
- 3h
- 4h
- Daily
- Weekly
- Monthly

Ichimoku Cloud conversion/base line crossIchimoku conversion/base line crossover to determine trade entrances and exits. Compare crossover point to relationship with the Ichimoku cloud (under, over or within) to determine strength of signal.